Crypto and Carry

History shows that crypto traders will go to dark places in pursuit of yield. To capture this demand, various platforms have sprung up offering telephone number sized APRs, and whose risks are more glossed over than the paint-job on the owner’s new Lambo.
Current market events
If you want to skip right ahead to the basis trade finding tool, you can check that out at cryptoncarry.com.
Crypto Derivatives
But first, a rapid-fire recap on some common crypto derivatives. As always, if you are familiar with these products then feel free to skip ahead to the next section.
A derivative is a type of financial product whose value is derived from the price of some other instrument (known as the underlying). Two of the most commonly seen derivatives in the crypto space are futures and perpetuals.
Futures
A future is a derivative that has a fixed expiry date, and which gives the buyer the obligation to receive the underlying once the future expires. Conversely, the seller of the future must provide the underlying to the buyer at expiry (so called physically settled futures). In practice however, most crypto futures are cash settled meaning that instead of the counterparties (the longs and shorts) exchanging the underlying, they instead exchange the cash difference. For instance, a BTC-0926 future uses Bitcoin (BTC) as the underlying, and settles on the 26th of September.
Because the future settles at some point in the future, the price of the future itself depends on what the market participants believe the price of the underlying will be when it settles. For instance, if the current price of Bitcoin is $20k, and traders believe that in a month’s time (when a Bitcoin future settles) the price will likely be $21k, then it is logical for the bitcoin future to trade at a price of around $21k.
The difference between the price of the underlying (BTC at $20k) and the price of the future ($21k) is known as the basis ($1k in this case). Normally, the basis is represented as a percentage of the underlying price, so

Chart showing a future that settles on 24/03/2021.
Often, exchanges will list multiple futures for the same underlying with different maturities (expiry dates). For instance, a future that expires at the end of the quarter, and another that expires the quarter after that. So for instance say that it is April 24th, BTC is trading at $20k, and there are two futures:
| symbol | underlying | expiry date | price |
|---|---|---|---|
| BTC-0624 | BTC | June 24th | $21k |
| BTC-0930 | BTC | September 30th | $22k |
The basis of the June future is 5% while the basis of the September future is 10%. The basis on the second future is higher, but are they comparable? We need to compare the time till expiry of both of these futures.
The June future expires in 61 days, while the September future expires in 159 days. We can compare the basis of these two futures by calculating annualised basis. We do this by taking the basis, and scaling it up as if it applied to the whole year. So in the case of the June future, the annualised basis is
Despite the absolute basis for the September future being larger, in annualised terms the June future has a higher rate. As the future gets closer and closer to settlement, the basis should move closer and closer to zero (since at settlement the future is worth the same as the underlying). To read about futures in more detail, check out this article.
Perpetuals
Futures settle once they reach their expiry date. Perpetuals are another form of derivative that (as their name implies) never settle. Like futures, they too track an underlying instrument. However, since they do not settle, there would appear to be nothing that forces the price of the perpetual to stay close to the price of the underlying.
To achieve this, perpetuals use a mechanism called funding. Funding is a periodic payment that is made between longs and shorts depending on the size and the sign of the funding rate. For instance, if the funding rate is positive, then traders who are long, pay funding to traders who are short. If the funding rate is negative, then traders who are short pay traders who are long.

Funding mechanism action as the perpetual’s price changes vs. the index.
You can calculate how much is paid by multiplying the current value of your position (e.g.
Had we been short, we would have received this amount. The funding rate is usually determined by keeping track of the difference between the underlying price, and the price of the perpetual itself. For instance, if the perpetual consistently trades above the underlying price, then the funding rate will be positive. Because (as we saw) traders who are long have to pay the funding, this encourages those traders to sell, thereby driving the price of the perpetual closer to the price of the underlying.
Different exchanges carry out funding in different ways. BitMEX for instance pays funding every 8 hours, while others such as dYdX do this every hour. Using this mechanism, the perpetual (in theory) stays close to the price of the underlying spot market.
Because the funding rate changes continuously, it can vary significantly at times. Traders who hold positions with perpetuals therefore need to keep a close eye on the funding rate in order to avoid potential losses if the funding rate turns against them. To read more about perpetuals, check out this article.
What is a Basis Trade?
With that out of the way, we can go into the mechanics of how a basis trade works. Both futures and perpetuals have an underlying asset from which they derive their price. In crypto, this is usually some specific coin such as BTC or ETH, etc. In a prior article about portfolio margin we covered the concept of delta (
Delta (Δ) is a risk metric that estimates the change in price of a derivative, such as an options contract, given a $1 change in its underlying security.
Delta measures how much the price of a derivative moves relative to its underlying. In the case of futures and perpetuals, their delta is always 1, which is why these products are often called delta one. Consider also, that the delta of any coin is also 1. Obviously, the coin’s price always moves one-to-one with its own price!
This is relevant, because when holding a combination of products (known as a portfolio) the deltas of those products can cancel out if a portfolio is constructed in the right way. Consider the following portfolio:
| instrument | quantity | delta | entry price |
|---|---|---|---|
| BTC | 10 | 1 | $20,000 |
| BTCUSD-300922 | -10 | 1 | $22,000 |
We have two components. 10 BTC bought at spot for $20k, and we are short 10 BTCUSD-300922 September future contracts. For simplicity, we assume that 1 future contract = 1 BTC, and we do not use leverage (1x). We note also, that the basis of the future is $2,000 or 10%. For this portfolio, what is our exposure to the Bitcoin price? I.e. how much will our portfolio gain or lose in value if the Bitcoin price moves?
*This isn’t exactly how you calculate Delta, as normally this is done with dollar exposure, however I am trying to simplify it here a bit to illustrate a point.
As it turns out, with this portfolio we are hedged against the price of Bitcoin moving, as our net delta is near zero. This is called being delta neutral. No matter how high or how low the BTC price goes at expiry, the profit of the portfolio will not change. This is important, as it means that by combining spot and future, we can create a combined product that has no price risk.
Fixed Basis Trade
We now have a portfolio that is not exposed to the price of BTC. We know however that the future that we have will settle on the 30th of September 2022. From the earlier section, we know that when a future settles, its price should be identical to the price of the underlying (the spot market). Consider two scenarios when the future settles (30th September):
In the first scenario, Bitcoin crashes to $5k and our future settles. What does our portfolio look like?
| instrument | quantity | entry Price | current price | pnl |
|---|---|---|---|---|
| BTC | 10 | $20,000 | $5,000 | -$150,000 |
| BTCUSD-240622 | -10 | $22,000 | $5,000 | $170,000 |
Our total profit on this portfolio (assuming we sell the Bitcoin for USD) is
Now, in the second scenario Bitcoin pumps to $60k. What is our PnL when the future has expired?
| instrument | quantity | entry price | current price | pnl |
|---|---|---|---|---|
| BTC | 10 | $20,000 | $60,000 | $400,000 |
| BTCUSD-240622 | -10 | $22,000 | $60,000 | -$380,000 |
Notice that once again, our profit is
In the video above, you see how as futures gets closer to expiry, the basis reduces to zero, and our profit increases. Be aware though that the basis will not always move exactly like this before expiry, and it is possible to e.g. have your portfolio be in a loss prior to expiry. However, you can get a guaranteed yield of the futures basis, assuming you enter both legs (the individual components of the portfolio) at the same time and hold till expiry. There are however some caveats here, which will be covered in the sections on margining and risks.
Variable Basis Trade
In the fixed basis trade we used a future in order to lock in a guaranteed (and fixed) yield of the future’s basis. However, the future has a fixed term, and once the future expires you will need to re-do the trade in order to keep earning yield. Perpetuals however do not settle, and instead continually pay/receive funding payments depending on whether you are long or short.
Like the future, the delta of the perpetual is 1, meaning that its price moves one to one with the price of the underlying. We can also construct a portfolio using the perpetual instead of the future:
| instrument | quantity | delta | entry price |
|---|---|---|---|
| BTC | 10 | 1 | $20,000 |
| BTCUSD-PERP | -10 | 1 | $20,000 |
Because of the funding mechanism, the price of the perpetual usually stays very close to the price of the underlying and hence here we enter both legs at a similar price. Because we entered at a similar price, we will not earn any fixed basis from this trade (it does not settle in any case). Due to the funding however, we will receive funding payments when the funding rate is positive. Conversely, we will pay funding payments when the funding rate is negative. Because we cannot guarantee funding, this means that the return on this trade is variable, ie. it may be higher or lower (or even negative).
Consider that we pay funding every 8 hours. Assume the perpetual has the following funding events over the next two days:
| timestamp | BTC price | funding rate |
|---|---|---|
| 2022.06.01T04:00 | $20,000 | 0.3% |
| 2022.06.01T12:00 | $21,000 | 0.5% |
| 2022.06.01T20:00 | $19,000 | 0.1% |
| 2022.06.02T04:00 | $18,000 | -0.2% |
| 2022.06.02T12:00 | $17,000 | -0.1% |
| 2022.06.02T20:00 | $18,000 | 0.2% |
We are short 10 contracts of BTCUSD-PERP. That means that if funding is positive we will receive a funding payment, and when it is negative we will have to pay it. Given our position, how much funding will we receive/pay for our 10 contract position? We can calculate it by figuring out the value of our position at each funding event and multiplying it by the funding rate. Positive means that we receive the payment.
| timestamp | BTC price | funding rate | received |
|---|---|---|---|
| 2022.06.01T04:00 | $20,000 | 0.3% | $600 |
| 2022.06.01T12:00 | $21,000 | 0.5% | $1,050 |
| 2022.06.01T20:00 | $19,000 | 0.1% | $190 |
| 2022.06.02T04:00 | $18,000 | -0.2% | -$360 |
| 2022.06.02T12:00 | $17,000 | -0.1% | -$170 |
| 2022.06.02T20:00 | $18,000 | 0.2% | $360 |
In total over the two days, we received a combined total of $1,670. Of course, in this case the funding was (mostly) in our favour. However, it is possible for the funding to be consistently negative which would cause us to accumulate losses. Unlike the fixed future trade, this trade has an element of unpredictability and risk. We can also keep this trade going indefinitely, at least, as long as we are comfortable with the funding environment.
In the video above you can see how the PnL on the trade is much more variable. Notice also that as the price between the perpetual and the spot diverges, our portfolio can gain or lose money due to the basis fluctuating. In general though, the perpetual’s price should remain quite closely tethered to the underlying. While this fluctuating basis can cause some variance; if the overall funding regime is positive the trade will slowly begin to accumulate profit.
Margining the Trade
In order to open a short position in a future or perpetual, you will require initial margin. This is essentially a deposit that is required by the exchange to open the position. The amount of margin required depends on your leverage, which allows you to multiply your gains (and importantly, losses). For instance, a leverage of 1x means you must pay the full amount to enter the futures position (e.g. if it costs $21,000, then $21,000 will be locked up). A leverage of 10x means you only need an initial margin of 10% (e.g. $2,100).
The problem with leverage however, is that if you lose money beyond the maintenance margin you will get liquidated (your position will be taken away). With basis trading this is obviously a risk, and so leverage is something to be used with great care. For more information about leverage and liquidation, check out this article.
To provide initial margin, it is not always required to just put up the cash outright. Different exchanges have different systems for handling margin.
Collateral Based Margining
Certain exchanges use a single currency as a margin currency. That means that all of their futures are quoted in a single currency, in this case USD. However, not just USD can be used as margin for a position. The system will also look at other assets that you own, and assign a dollar value to them. Typically, each asset will have a haircut or weight meaning that its dollar value is discounted by some factor when used for margining.
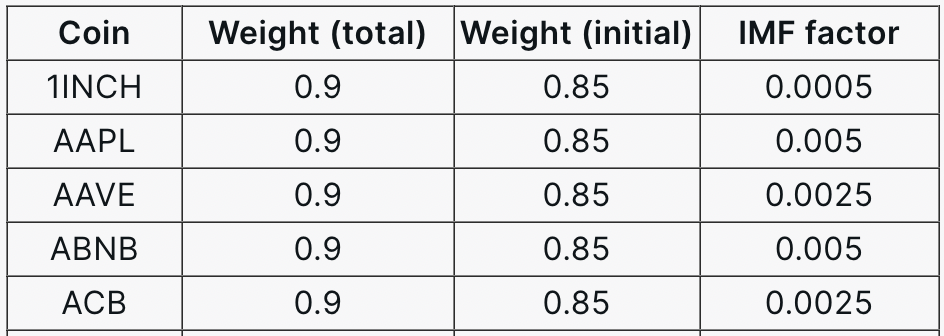
Sample of coin haircuts used on FTX. Source: FTX: Non-USD Collateral
Consider for instance holding 2BTC which currently have a price of $20,000 and a haircut of 0.9. This means that for the purposes of margining futures, you have
Be aware of the haircut however! Consider the following scenario: You buy 1 BTC spot at $20,000, and sell a 1 BTC perpetual also at $20,000. Your margin requirement for the perpetual is $20,000 however the 1 BTC that you bought has a haircut of 0.9, meaning that it can only provide $18,000 of collateral. This means that your position is actually leveraged (to be exact, your leverage is
Inverse Contracts
Exchanges such as BitMEX and Binance offer an interesting type of derivative known as an inverse perpetual/swap. You can read in full about how this contract type works in this article, however long story short, it is a contract whose margin currency is the same as the base currency. For instance, an inverse BTCUSD future is priced in USD, but is actually margined in Bitcoin.
This type of instrument is great for basis trades, because the spot leg that you bought is also the same coin that is used for margining the derivative leg. This combination of spot and inverse future/perpetual was nicknamed “Synthetic USD” by BitMEX founder Arthur Hayes.
Cash Only
For exchanges that do not offer collateral, inverse contract margining or who weight the collateral at 0, then the derivative position would need to be purchased in pure cash. The downside of this is that it is less capital efficient than the other methods. You need to purchase the spot coin, and also sell the future requiring likely a similar amount of margin. This means that your return on investment or ROI is cut in half due to not being able to utilise the spot leg as collateral.
Risks
While a correctly set up basis trade has no price risk (it is fully hedged) there are other risks that need to be accounted for. Below we list some of the main ones.
Liquidation Risk
This risk does not apply to you if you do not use leverage. However, if leverage is used, then the position must be closely watched in order to make sure it does not get liquidated. If you do get liquidated, it is likely that you will lose not only the derivatives position but also all of the collateral. Avoid like the plague.
Socialised Loss Risk
Crypto derivatives exchanges usually will have some sort of socialised loss mechanism in order to protect the exchange in the case of an uncollateralised loss. Systems such as clawbacks or auto-deleveraging can close your position early through no fault of your own if this occurs. This is a risk which (while rare) is honestly hard to protect against, though if you use no leverage you should be quite low down the ADL priority queue. Ideally choose an exchange with good risk management and/or a large insurance fund. Check out this article for more info.
Funding Risk
As mentioned above, if you have a basis trade using a perpetual then you are subject to the funding rate. If the funding rate moves against you (becomes negative) then you will end up consistently paying funding, and lose money. Keep a close eye on the funding rate, and consider exiting the trade if it doesn’t look it will improve. This is of course all subjective, so you will need to do your own research.
Basis Risk
For perpetuals, the funding rate is meant to keep their price relatively tethered to the price of the underlying. However, unlike futures this is not necessarily guaranteed. A potential issue can be as follows: You enter the trade while e.g. the perpetual is 1% above the underlying, and the basis is positive. The funding rate is in your favour, however the difference between the perpetual and the underlying increases to 2%. Because you are short the perpetual, this results in a loss if you exit the position.
Liquidity Risk
The idea of the basis trade is predicated on entering and exiting at similar prices for the spot and derivative legs. However, this may not always be possible. When trying to exit a trade, there is a risk that there may not be sufficient liquidity to do so. When this occurs, you may end up facing significant slippage which can lead to losses on the trade.
Counterparty Risk
Finally, by trading on an exchange, they are in effect a counterparty to you. After all, they hold your funds and list the derivatives contracts you are trading. Exchange hacks and blowups are not unheard of. Due diligence is always recommended when opening positions with any exchange.
Why Does the Basis Trade Exist?
A question that is commonly asked is why such a trade exists? Isn’t this a form of free lunch? The real question here though, is why is there a difference between trading the derivative vs trading spot?
The primary difference, is leverage. There is generally heavy demand in the crypto markets for directional speculation. The spot market often does not have the liquidity required for large bets, so the derivatives market (where leverage is available) is used instead. Demand in a certain direction (long or short) drives the price beyond the price of the underlying, the price of this demand is therefore the basis/funding. The following tweet from Sam Bankman-Fried is often rolled out as an explanation for this phenomenon:
People in crypto want to be long
— SBF (@SBF_FTX) April 8, 20211T.
The outside world is willing to lend2T, and people bid up interest rates on the other $0.5T of exposure. https://t.co/RwLFh2YwV0
Consider that if the market is bullish, the funding rate on a perpetual will typically be positive. Traders are constantly bidding up the price of the perpetual above the index. If the funding rate is positive, those traders who are long will continually pay funding to those who went short. They are willing to do this, because they believe that the price of the underlying will be EVEN higher in the future, which will offset (and hopefully exceed) the funding costs of the long position.
The viability of this trade tends to be highly correlated with how bullish the market is. At the time of writing we are in a global bear market, and most fixed basis trades will offer perhaps 3-5% annualised. However, back in the turbo bull run days of early 2021 a FIXED basis trade at times could return 30%+ annualised! That might seem like a lot, but consider that by carrying out this trade, you are giving something up also.
By being short the future and long the spot, you have given up your ability to participate in the (potentially unlimited) gains of the underlying. But, you are compensated for this by being paid the fixed basis. The basis trade is therefore a way for those who are less willing to speculate to provide price exposure to those who are, albeit at a cost. Consider that back in 2021 you may well have earned 30% on your BTC basis trade, but in the same time just by holding Bitcoin you could have made a 300% (or more) profit!
Trade Variations
We have so far covered the long spot / short derivative basis trade. As the title of this article suggests, this trade is sometimes called a cash and carry trade. There are however, different variants of this trade that have both pros and cons. We cover some of these below.
Spot Borrow Variation
The trade we described earlier only works when the basis or funding rate is positive. However, it is possible to carry out a basis trade when the basis or funding is negative, but it involves a few extra steps.
The core concept of the cash and carry trade is going long spot and short future/perpetual. If the basis is negative, what you need to do is go short spot and long future/perpetual. Going long the derivative is easy, however going short spot is a bit harder. In order to do this you will need to borrow the underlying in order to sell it. Platforms that have a borrow/lend book will allow you to do this, however you will need to have sufficient collateral to execute the borrow.
In addition, you will need to pay interest on the borrowed spot which will eat into your potential profits. To top it off, your spot loan has the possibility of being margin called if the value of your collateral falls. This adds extra dimensions to your risk profile, meaning that such a trade involves a bit more analysis and modelling up front.
Using a Perpetual Instead of Spot
Astute readers may have noticed that leveraging the basis trade is complicated by the fact that the spot component is more difficult to leverage. In addition, borrowing spot can incur expensive interest payments which eat into profits.
One alternative is to use a perpetual in place of the spot leg. Due to the funding mechanism the price of the perpetual should generally track the price of the underlying, making it a useful substitute for the spot leg. Using a derivative for both legs allows you to lever up the trade on both legs, potentially increasing returns. Of course, it also exposes you to a much higher risk of liquidation.
There are some downsides to using this method. One catch is that what would have been originally a fixed return trade now becomes variable due to the funding component. To make matters worse, the basis and funding rate are typically quite correlated because when people are bullish short term they are often bullish long term as well. For instance, you might lock in a 2% basis on the spread between the perpetual and future, but because you long the perpetual, you will continually pay e.g. 0.02% cutting into the 2%. Of course, the opposite could happen, and you double-dip on the futures basis AND the negative funding rate. Such is variance.
Another catch is that the perpetual will usually not be usable as margin for the future. This fact means that usage of leverage is almost mandatory, as otherwise your capital requirements will be almost 2x that of the regular spot version. If the exchange has portfolio margin available, then this will reduce the margin required as the delta of the whole portfolio (zero) will be taken into account when calculating margin. However, this feature is typically only available to larger institutional users and requires a good understanding to use properly.
Calendar Spreads
Another combination is to use futures for both legs. A calendar spread is a type of trade where one goes long a future at a certain expiry, and goes short a future with the same underlying but with a different expiry. The trader then makes the spread between the basis of the two futures.
For instance, imagine that we have a June future with a basis of 2% and a September future with a basis of 5%. The trader can go long the June future, and go short the September future thereby capturing the spread of
In addition to this, the calendar spread also has all the downsides of the other dual-derivative methods such as risk of liquidation, and inability to use one future to margin the other.
A Tool For Assessing Basis Trades
I’ve built a tool for assessing potential basis trades. You can find it at www.cryptoncarry.com (a domain which I was happy to pick up).
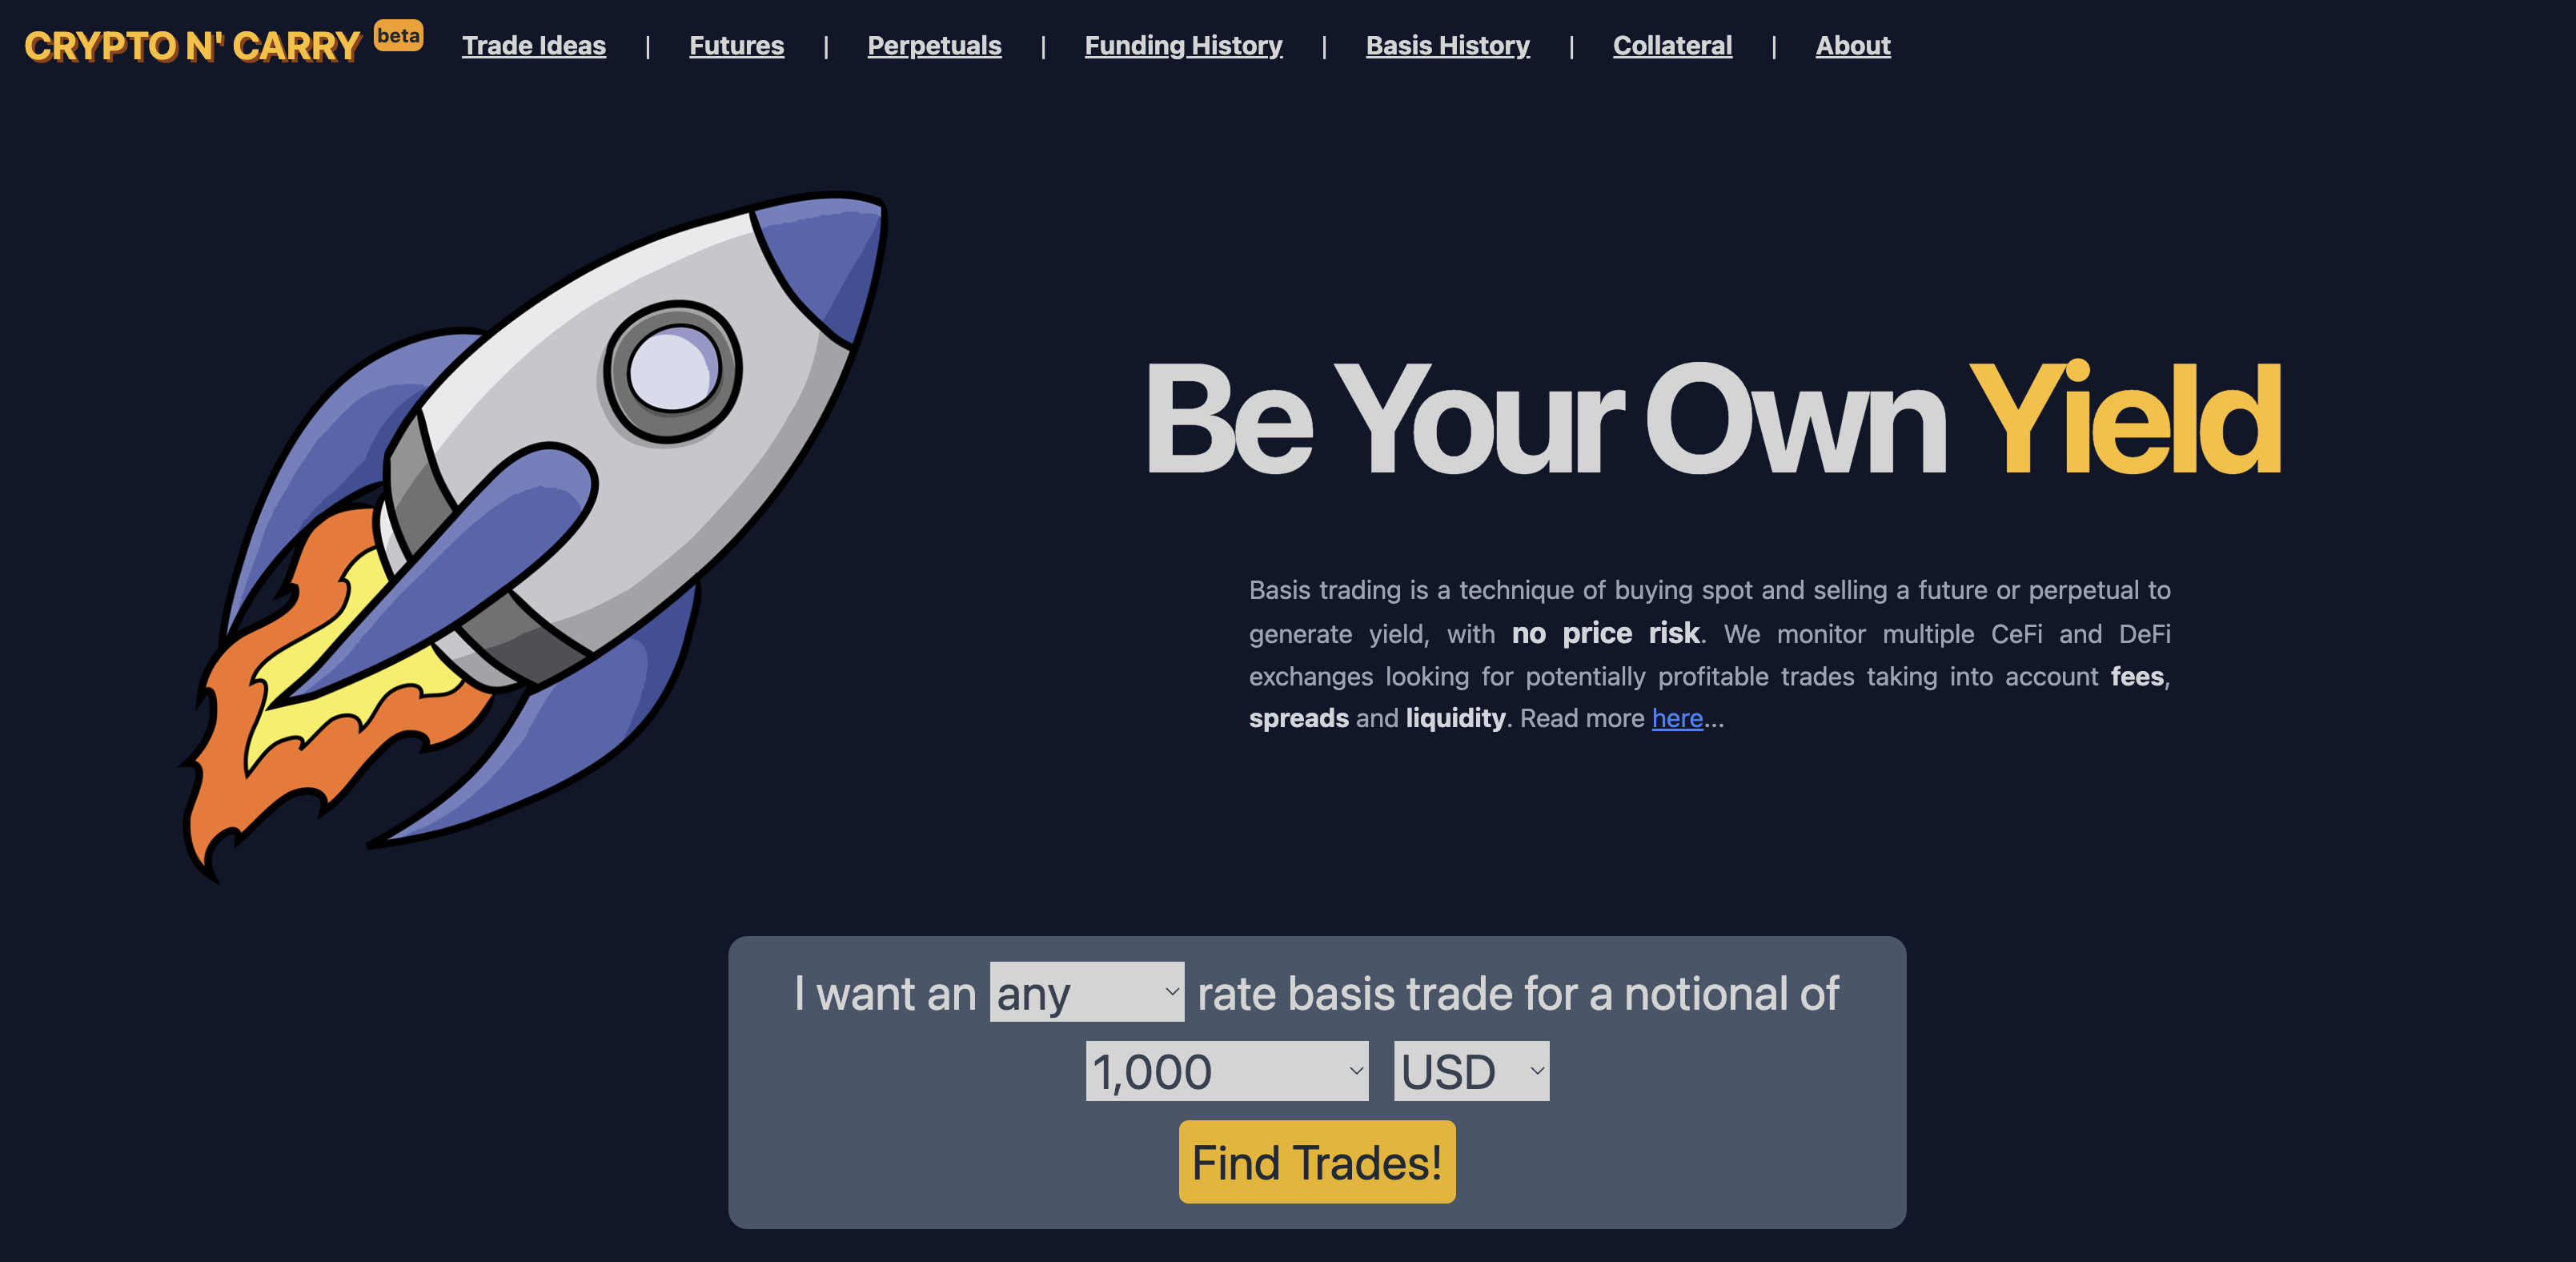
This website will periodically scrape a variety of different CeFi and DeFi exchanges and collect data that is then used to assess the suitability of various basis trades. The approach is quite basic, as the site only looks for the standard carry trade (spot + future/perpetual) however the aim of the site is to try and provide specific data that is relevant to doing this trade. I’ve even set up a Twitter bot to send out the top basis trades daily, you can follow it at @cryptoncarry.
Check out the following features:
Trade Ideas
This page shows a list of potential basis trades. This list is refreshed every few minutes, and attempts to estimate a return based on some trade assumptions. While it is easy to look at the basis or funding for a derivative, and assume you know the return, in reality it is more complicated.
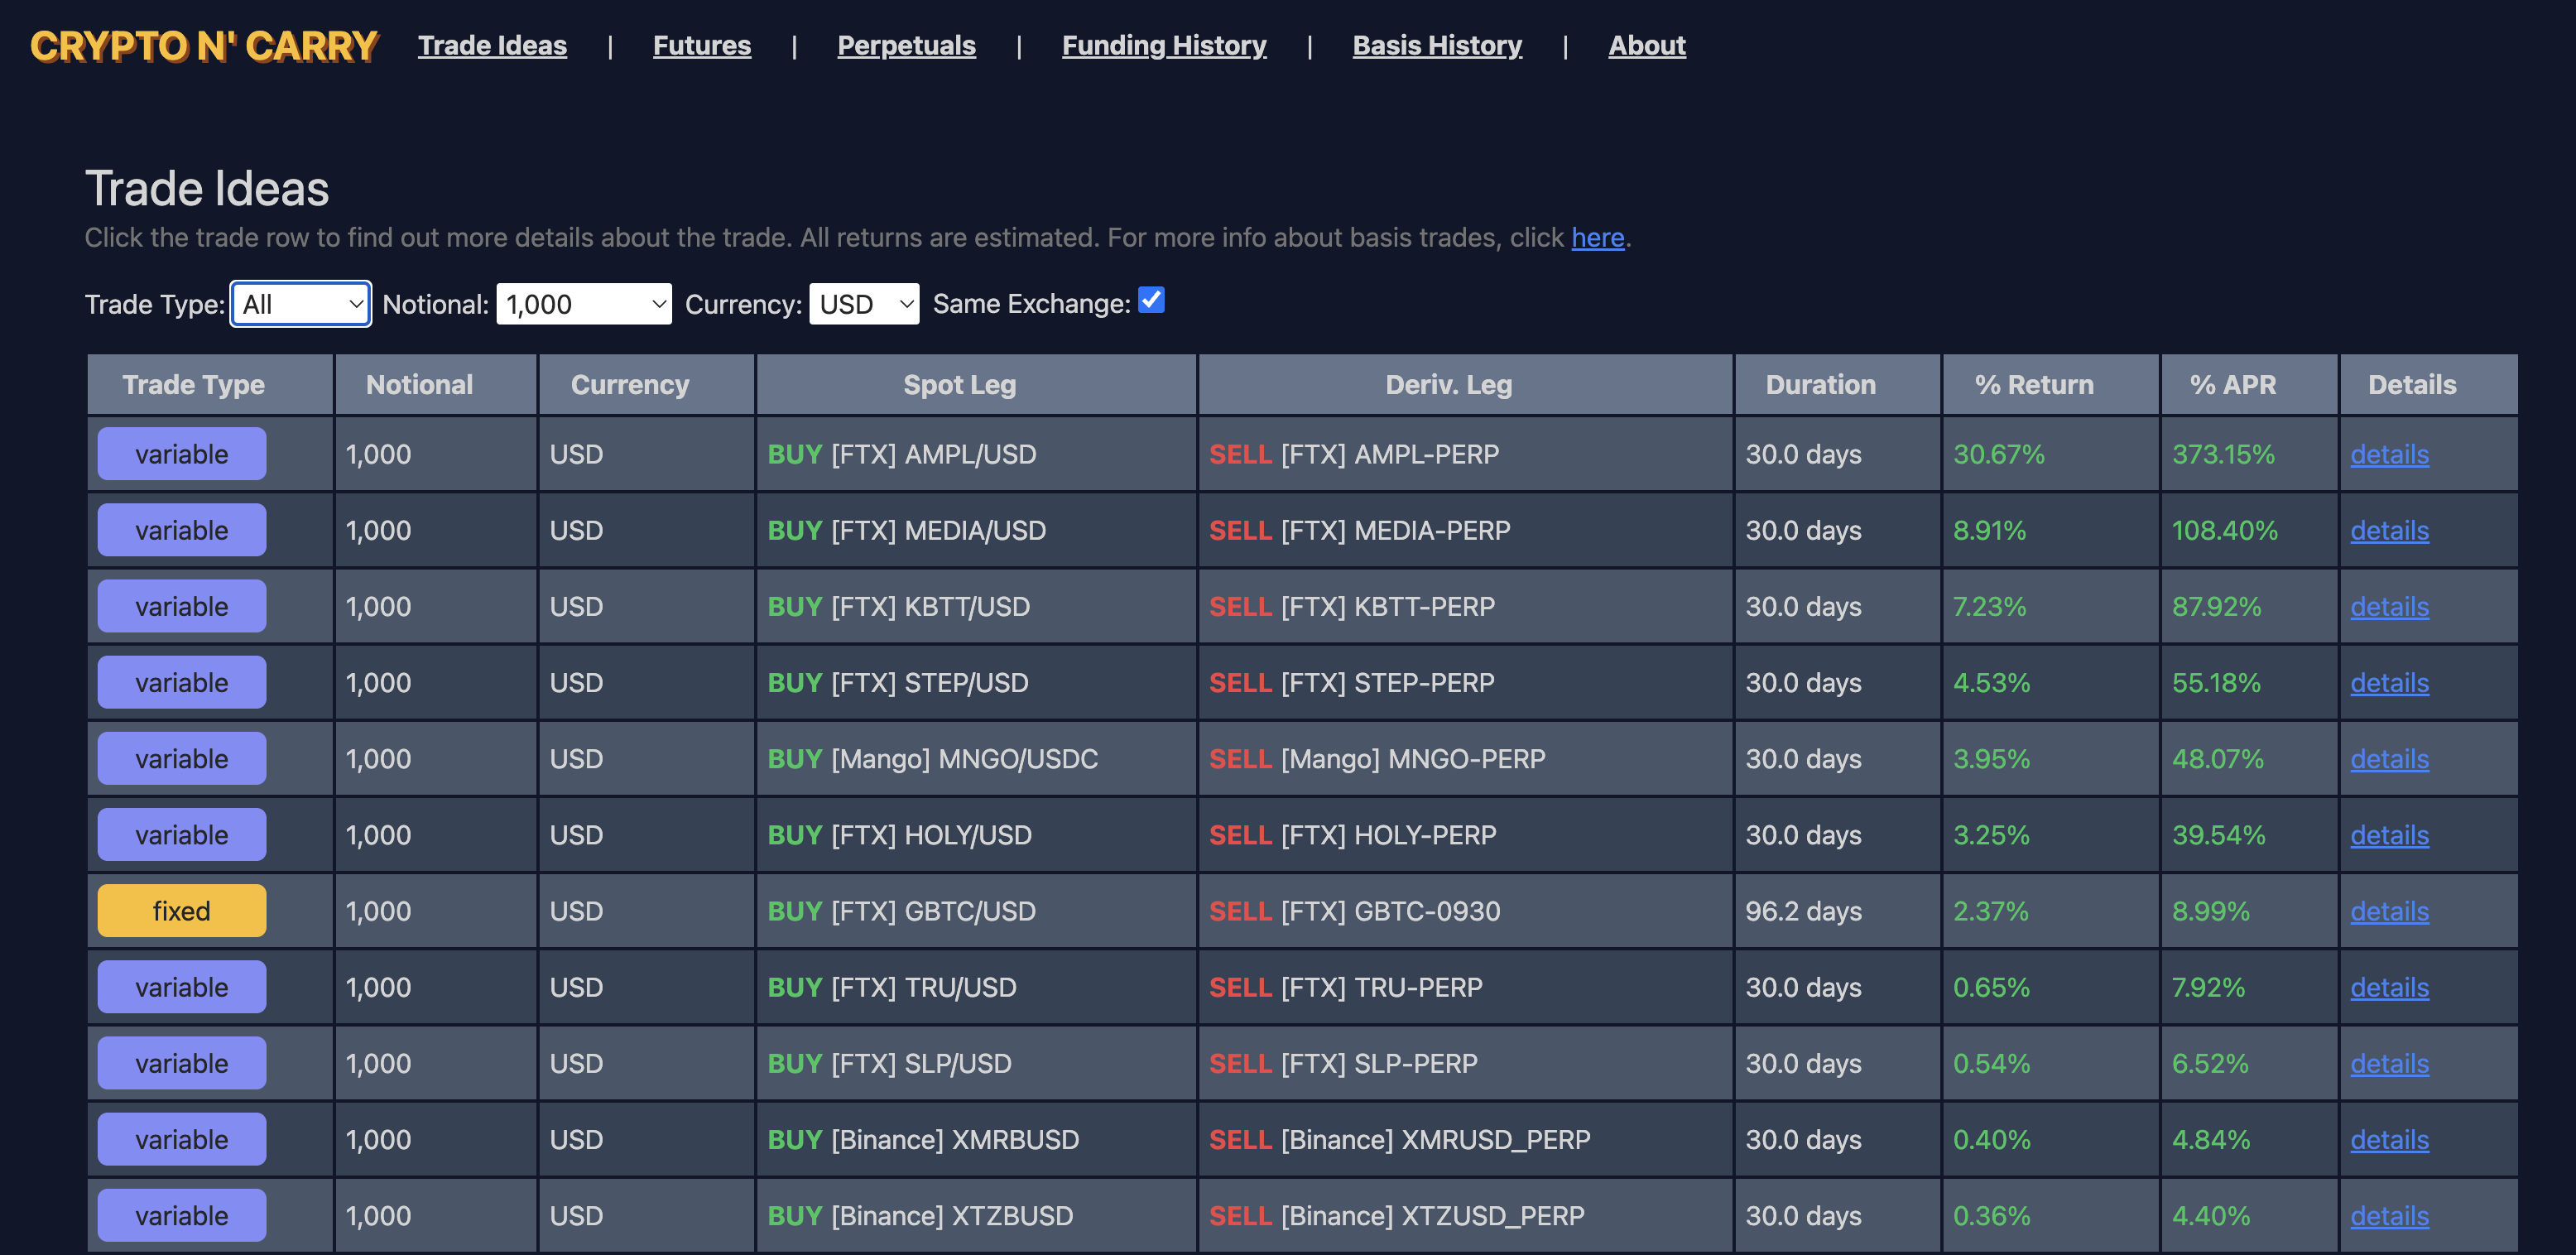
The trade ideas page shows estimated returns for different trade possibilities.
In this case, it works as follows:
- Assume the initial return of the trade is the current basis (for fixed rate trades) or 7 days worth of the average funding rate for the last 7 days (for variable trades).
- Assume that to enter the spot trade you will be aggressive on both sides, so pay half of the spread on both the spot and the derivative.
- Because we are the taker on both sides, pay the taker fee for both spot and derivative.
- Depending on the size of the trade, account for the slippage that we will suffer on the average entry price on the spot and the derivative.
- Assume that the trader does not use leverage, and will (where possible) use the underlying coin as collateral for the derivative leg. If the asset has a haircut, then assume the trader will top up the difference in cash to enter the derivative leg. If the collateral is unusable for the derivative, assume that the derivative is margined fully in cash. Adjust the return accordingly.
This final return is then annualised for easy comparison. Use the filters and the sorting to narrow down / sort the trades. To see more details, click on the trade itself (or on the details link). This will show you more information about the trade such as the slippage and impact, specific quantities, funding / basis history, risks, as well as instructions on how to execute the trade.
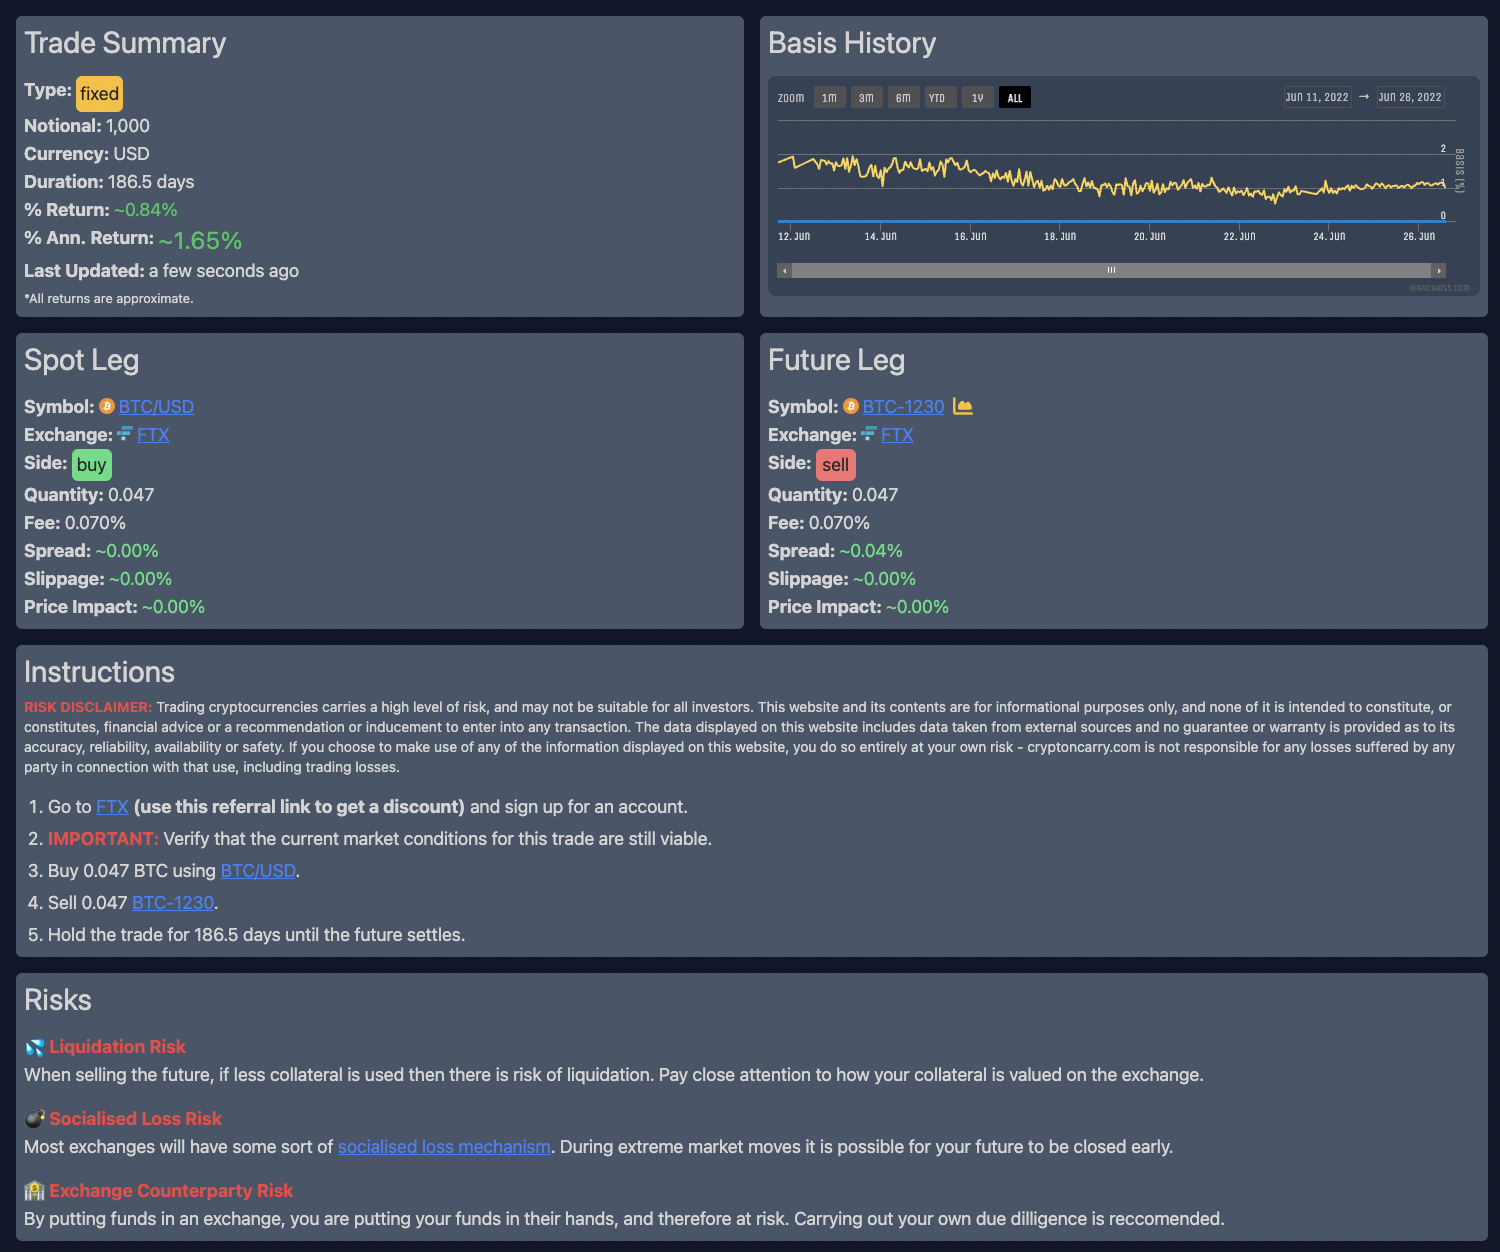
The trade detail view shows more information about the trade itself.
If you are interested in carrying out any of these trades, feel free to use my affiliate link when signing up for an exchange. Be aware that if you do carry out any trades, they are at your own risk and nothing on the site should be taken as trading advice. It is purely for informational / educational purposes, and you should read the risk disclaimer for more info.
Futures
The futures view shows information about individual futures from different exchanges. Use the symbol filter to find specific products.
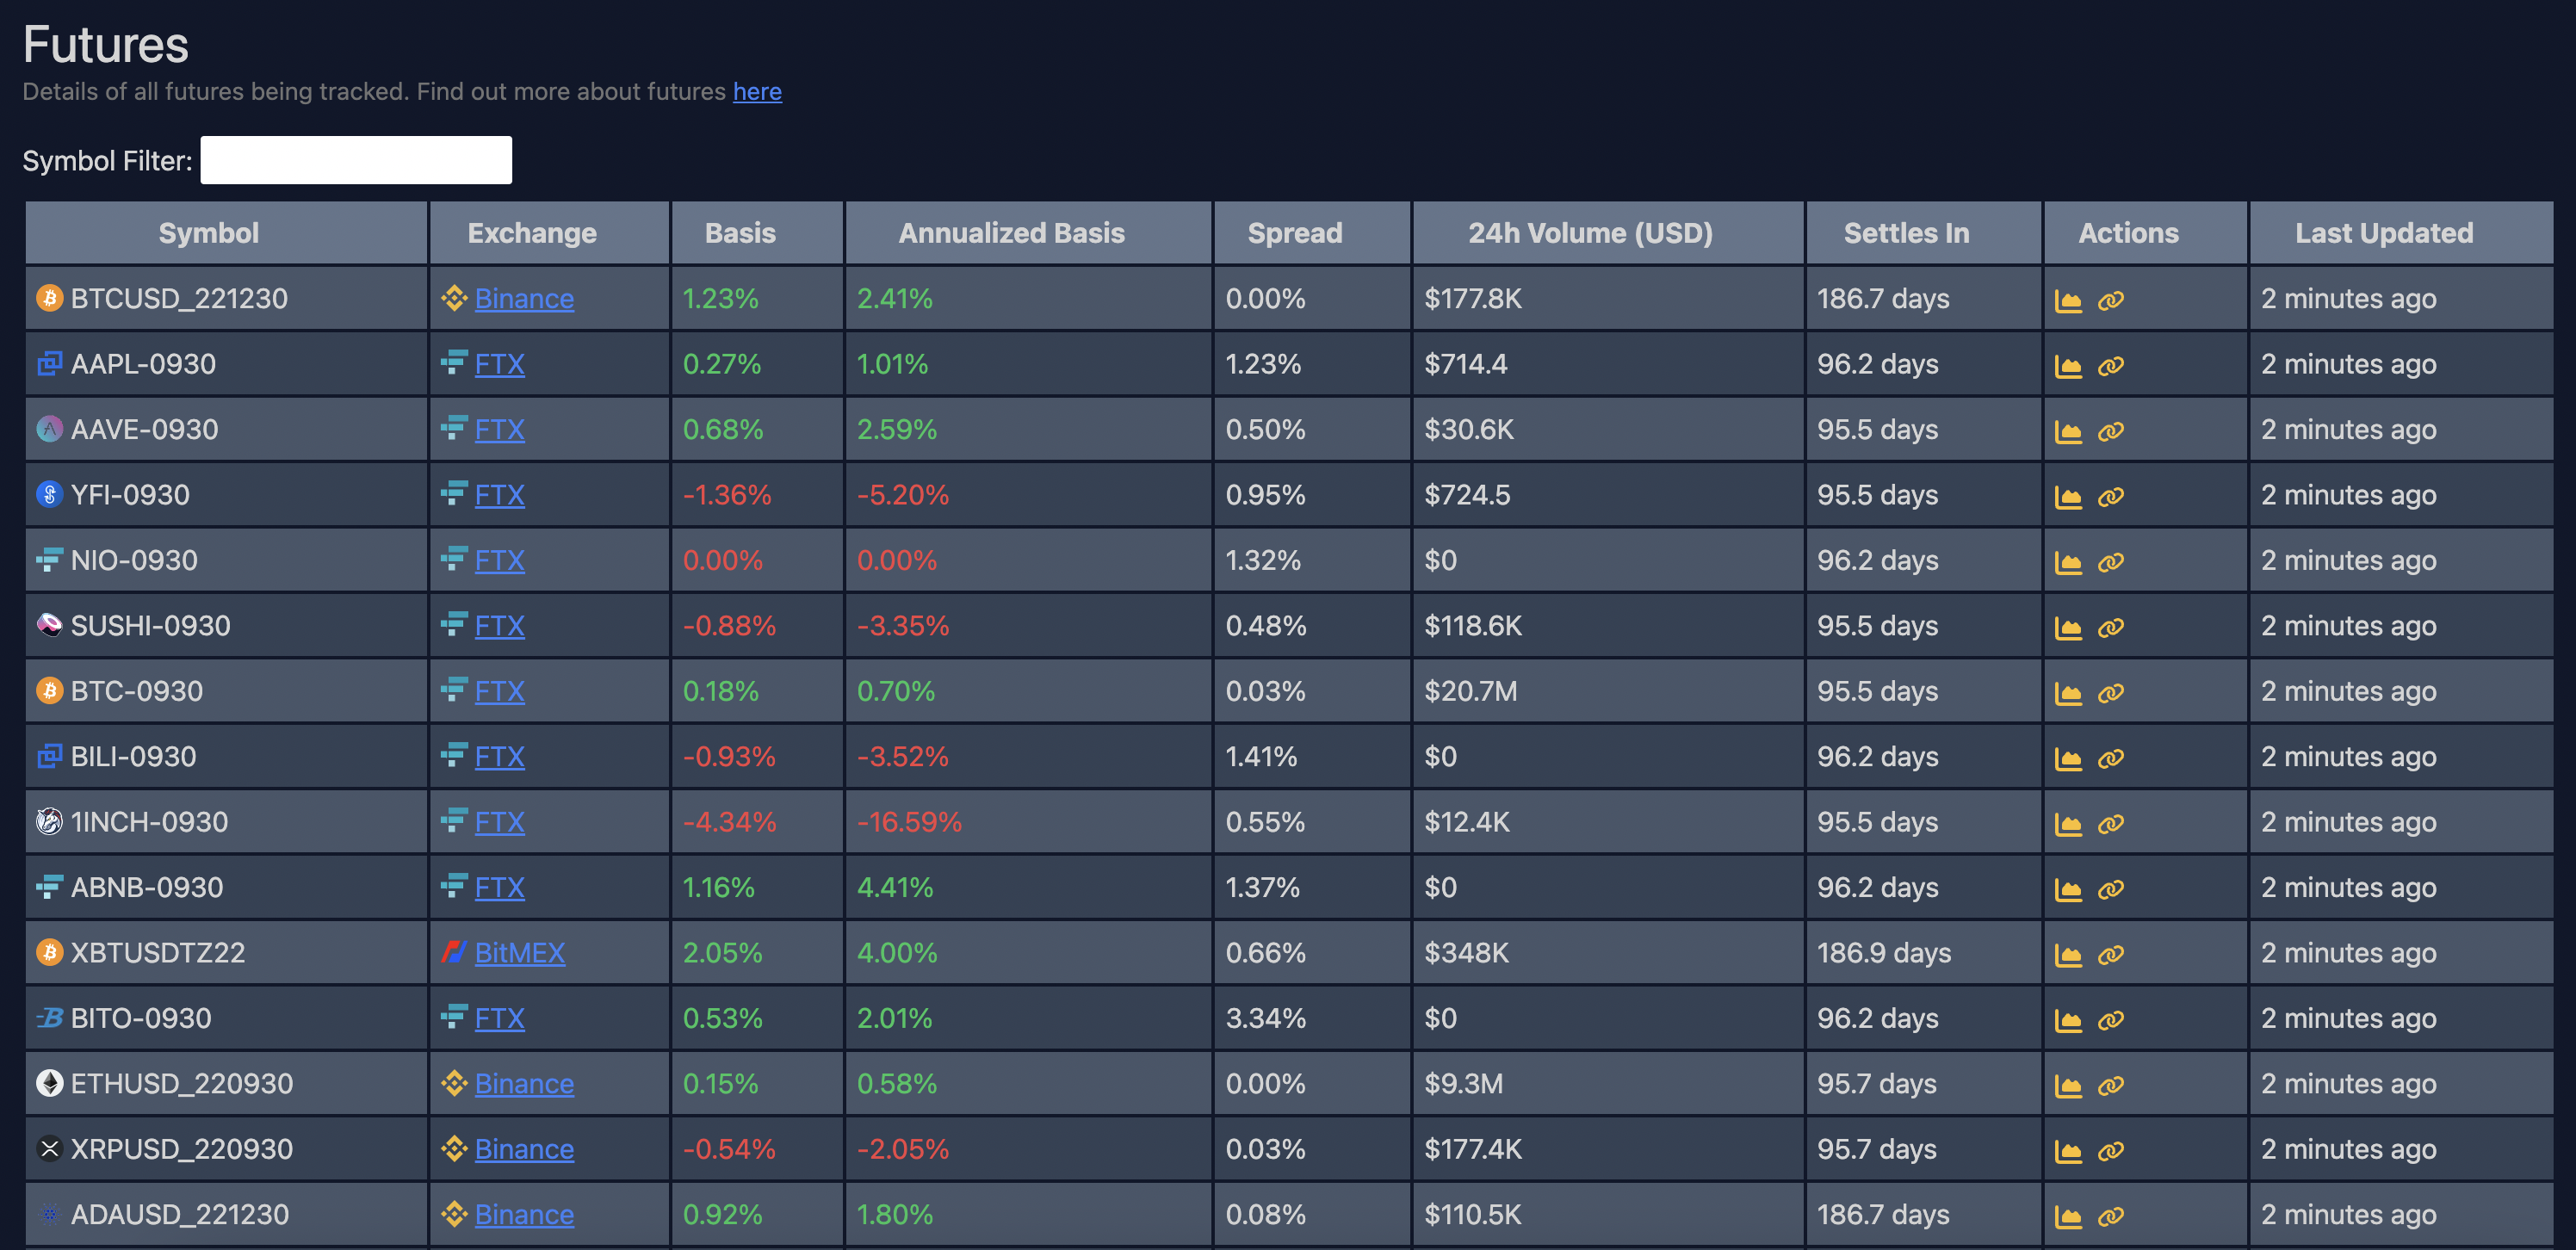
The futures view shows info about individual futures.
Perpetuals
The perpetuals view shows information about individual perpetuals from different exchanges. Use the symbol filter to find specific products.
One important feature here is the average funding rate view. The site constantly captures the funding for each perpetual, and then is able to calculate an averaged annualised funding rate over different time periods. For instance the 7 day annualised average funding rate is simply the average of all of the funding events over the last 7 days, scaled up to 365 days (1 year). The site uses the 7 day average funding rate as the assumed funding rate for estimating trades, but keep in mind that this is a very rough estimate, as the funding rate can change at any time.
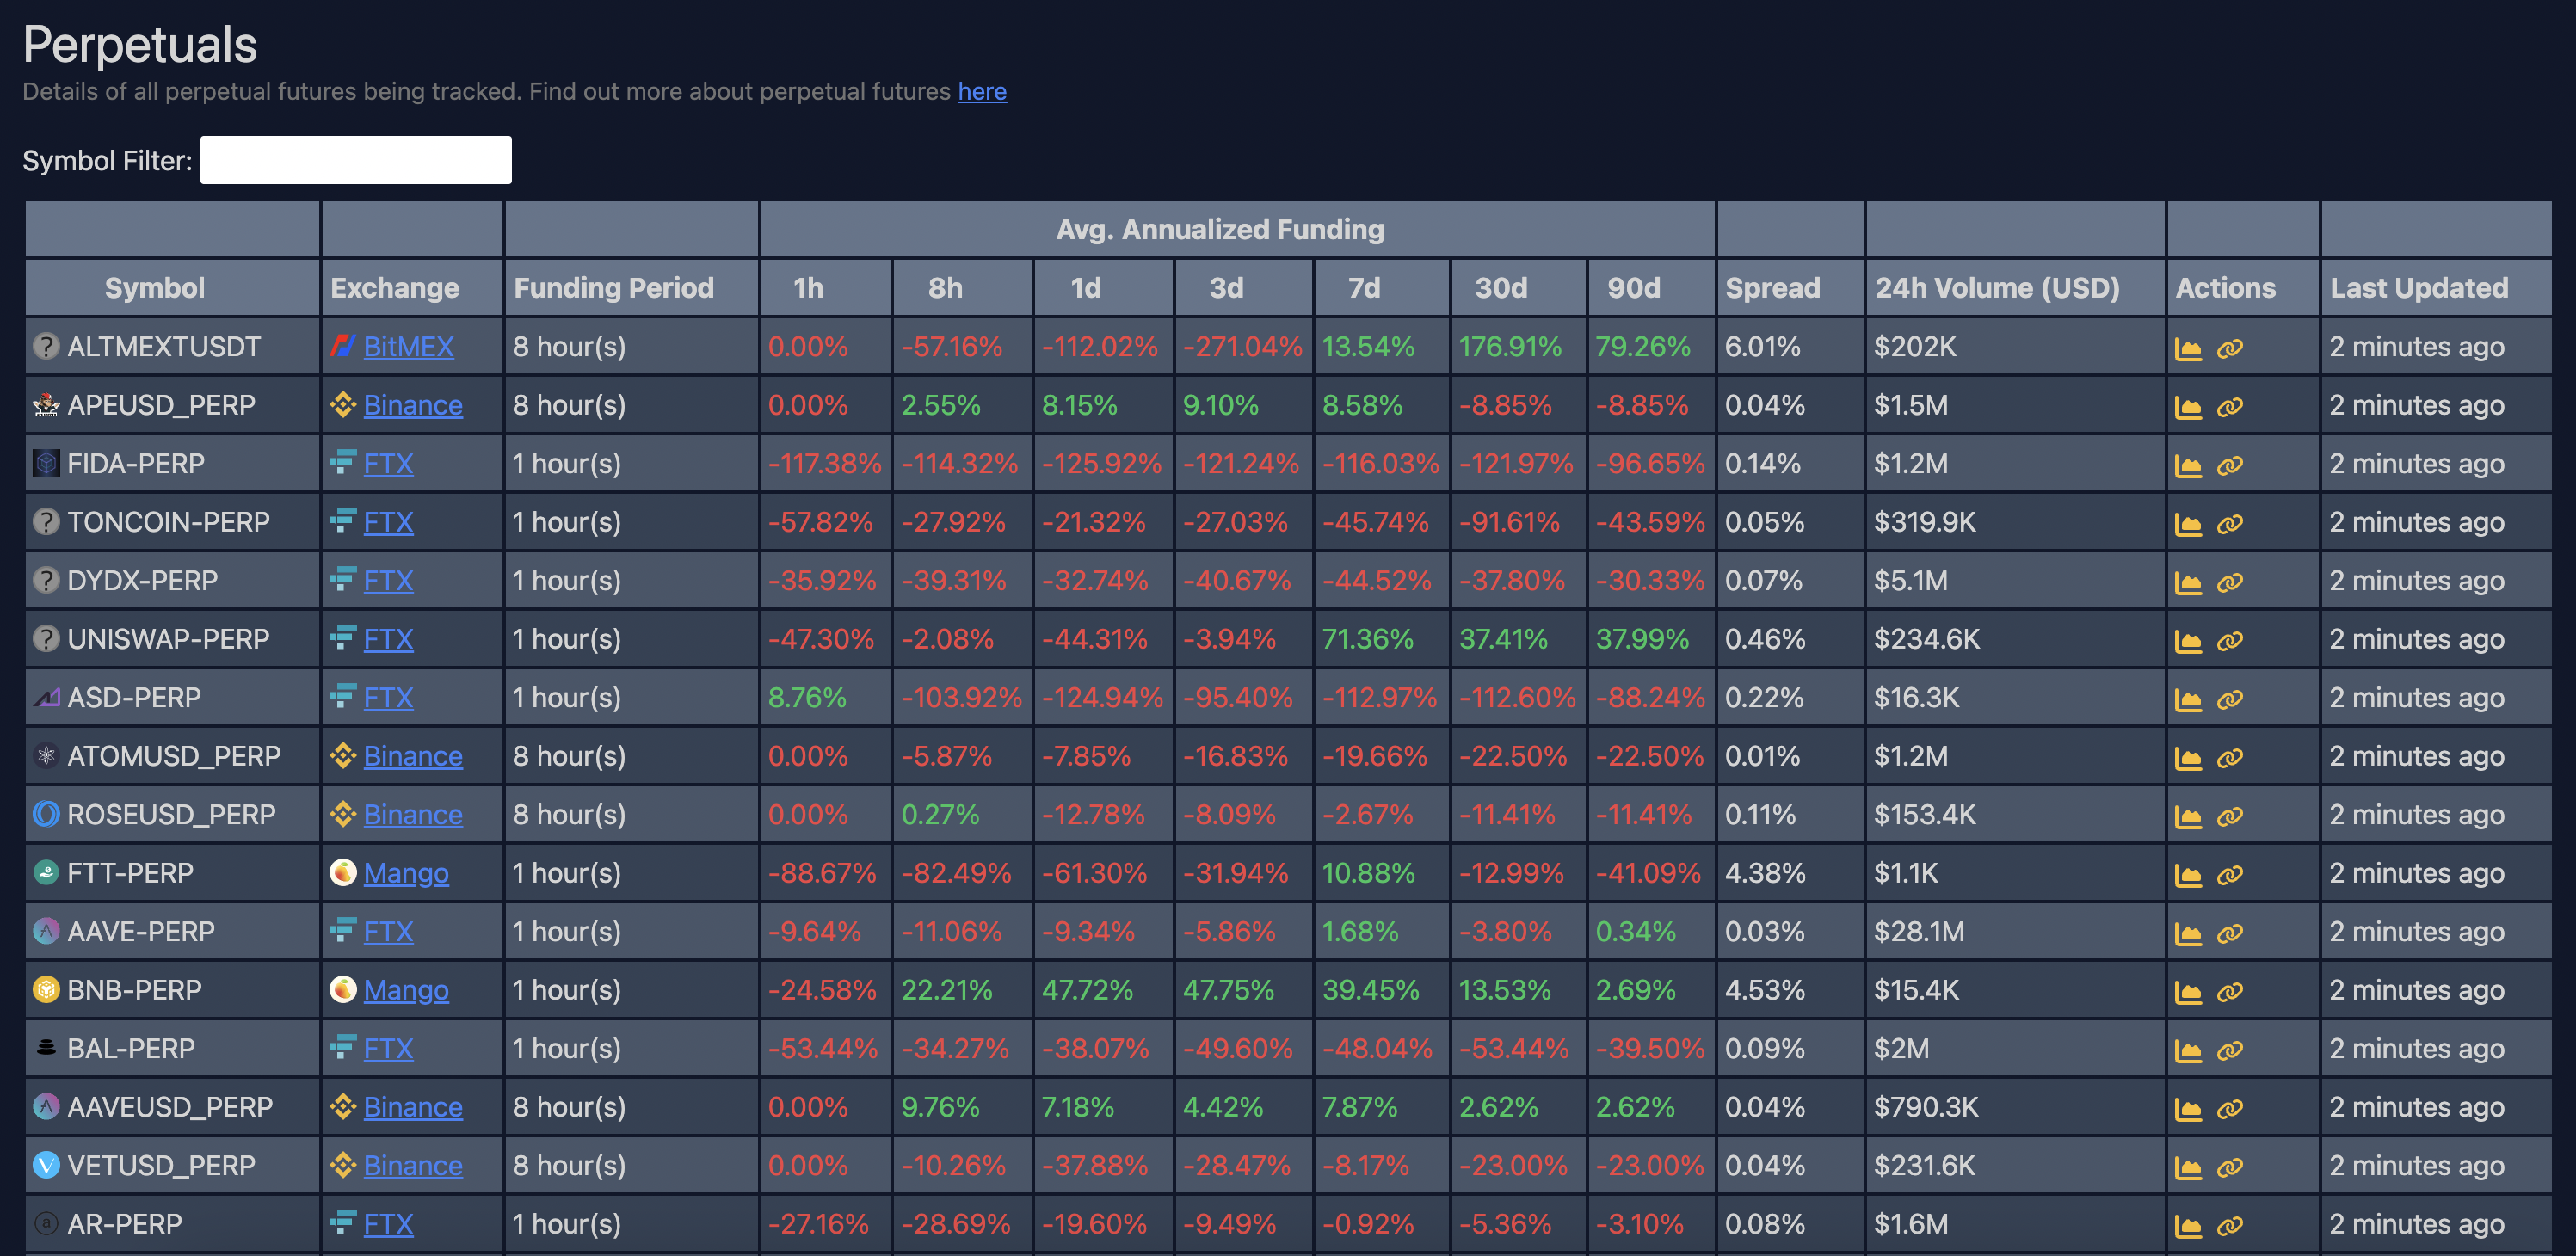
The perpetuals view shows info about individual perpetuals.
Funding History
The funding history view shows a chart showing the last 90 days of funding events for a perpetual. Use the dropdowns at the top to select a symbol/exchange. This view can be useful in assessing how the funding has behaved over the last few months.
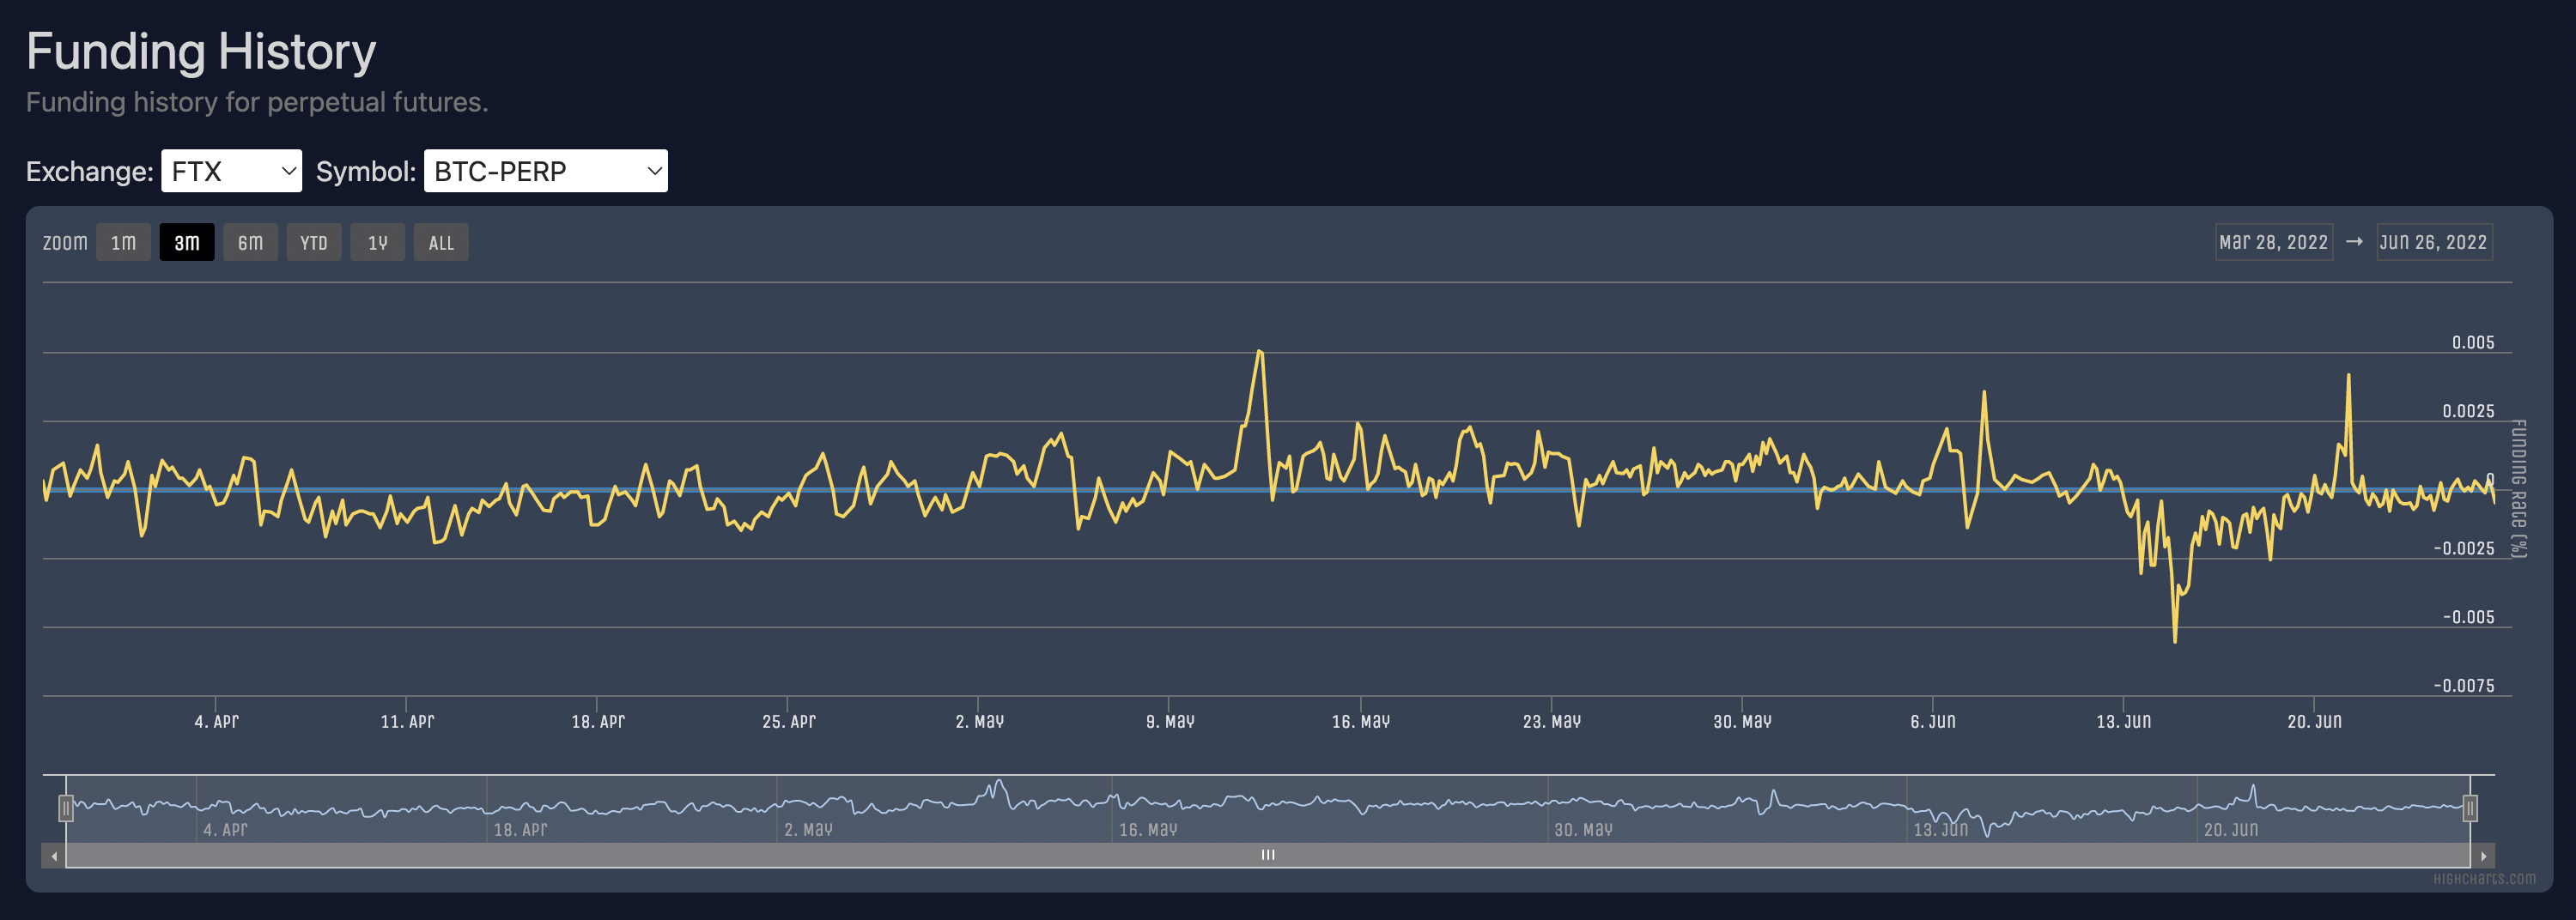
The funding history shows the last 90 days of funding events for a perpetual.
Basis History
The basis history shows how the basis of a future has changed over the last 90 days. With futures, while you expect to see some variance in the basis the general trend tends to be towards 0 as the future gets closer to expiry.
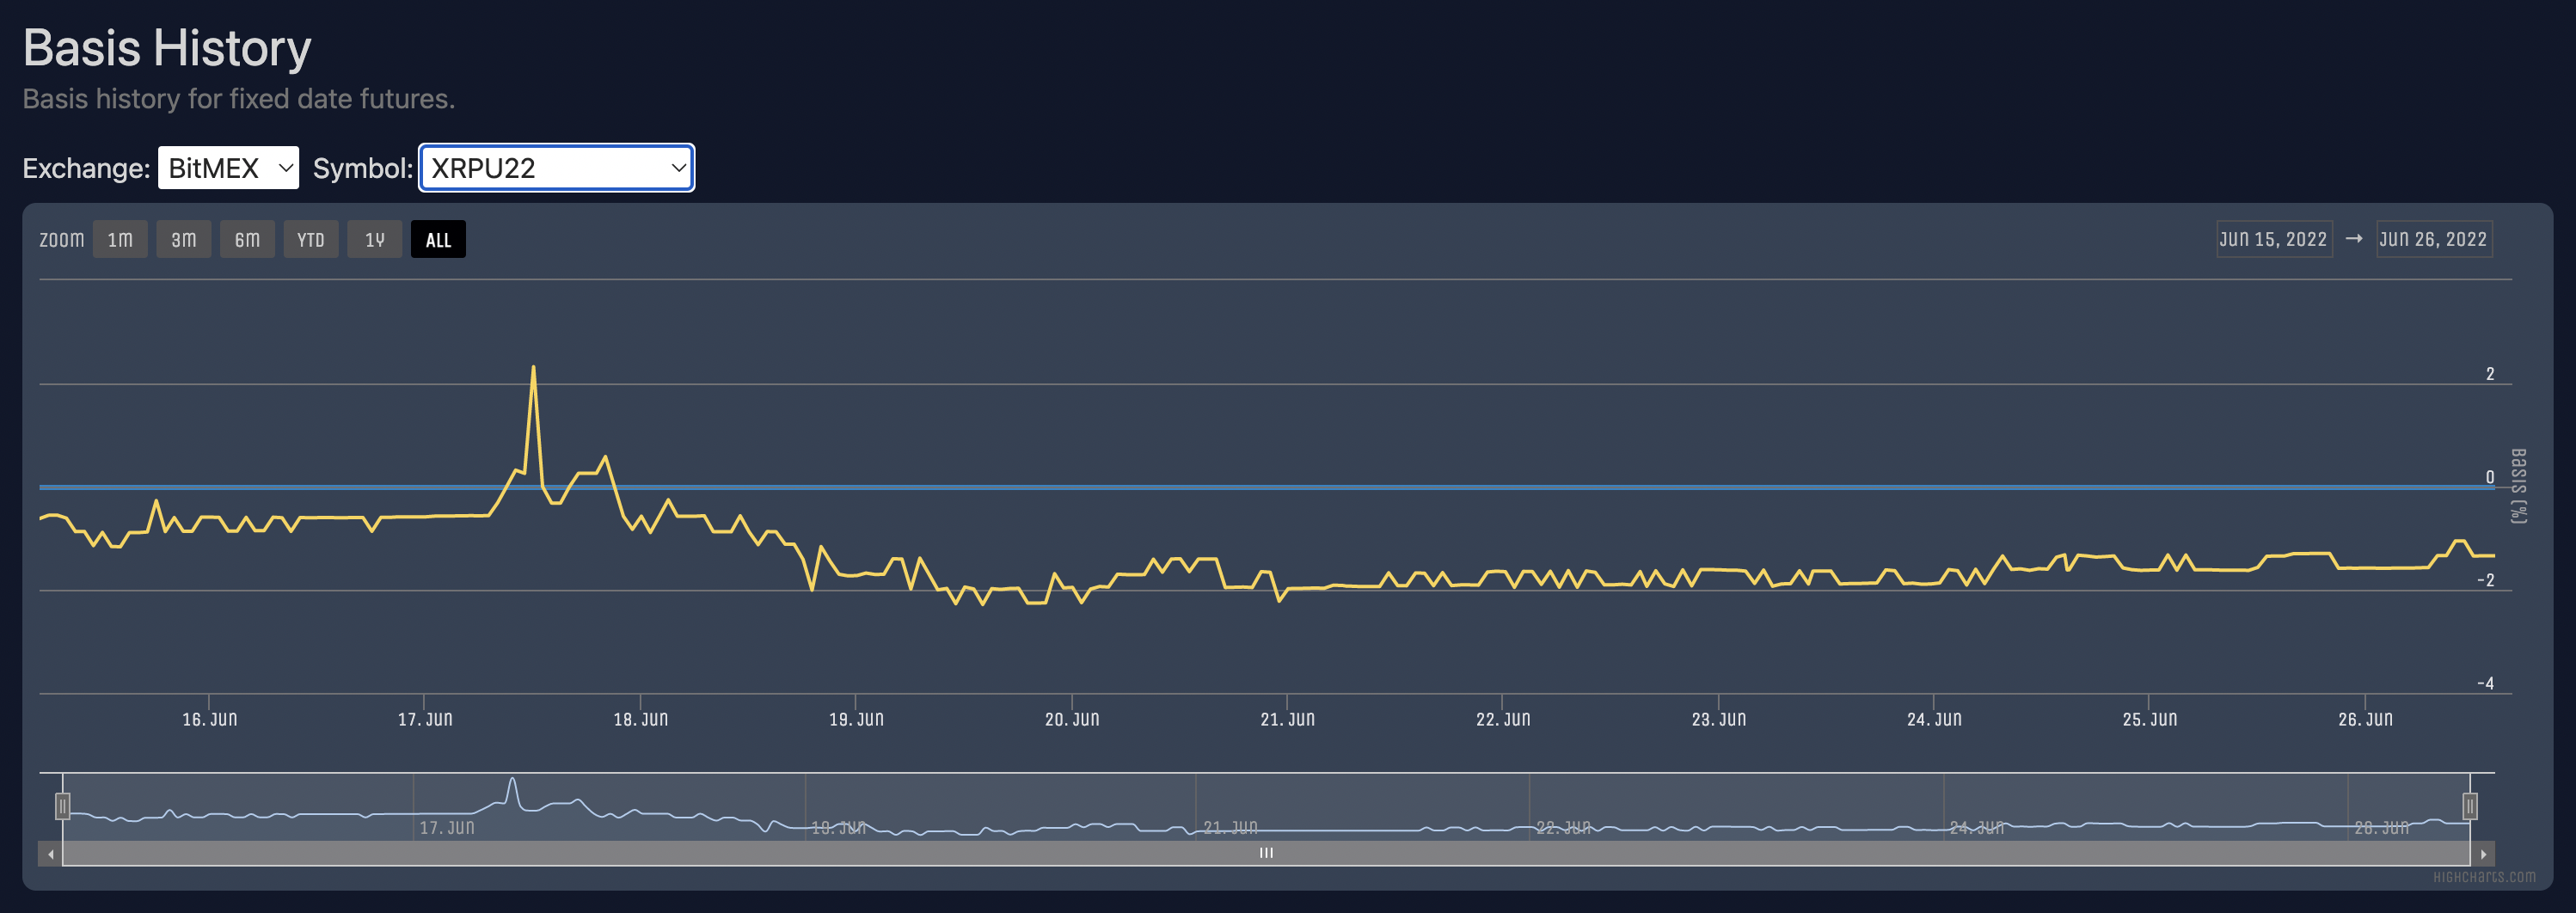
The basis history shows the last 90 days of the basis for a future.
Collateral Weights
As mentioned previously, certain exchanges use a form of cross-asset margining meaning that different currencies may have different conversion weights to USD or whatever the margining currency is. This page keeps track of the different weights from the exchanges that support this system.
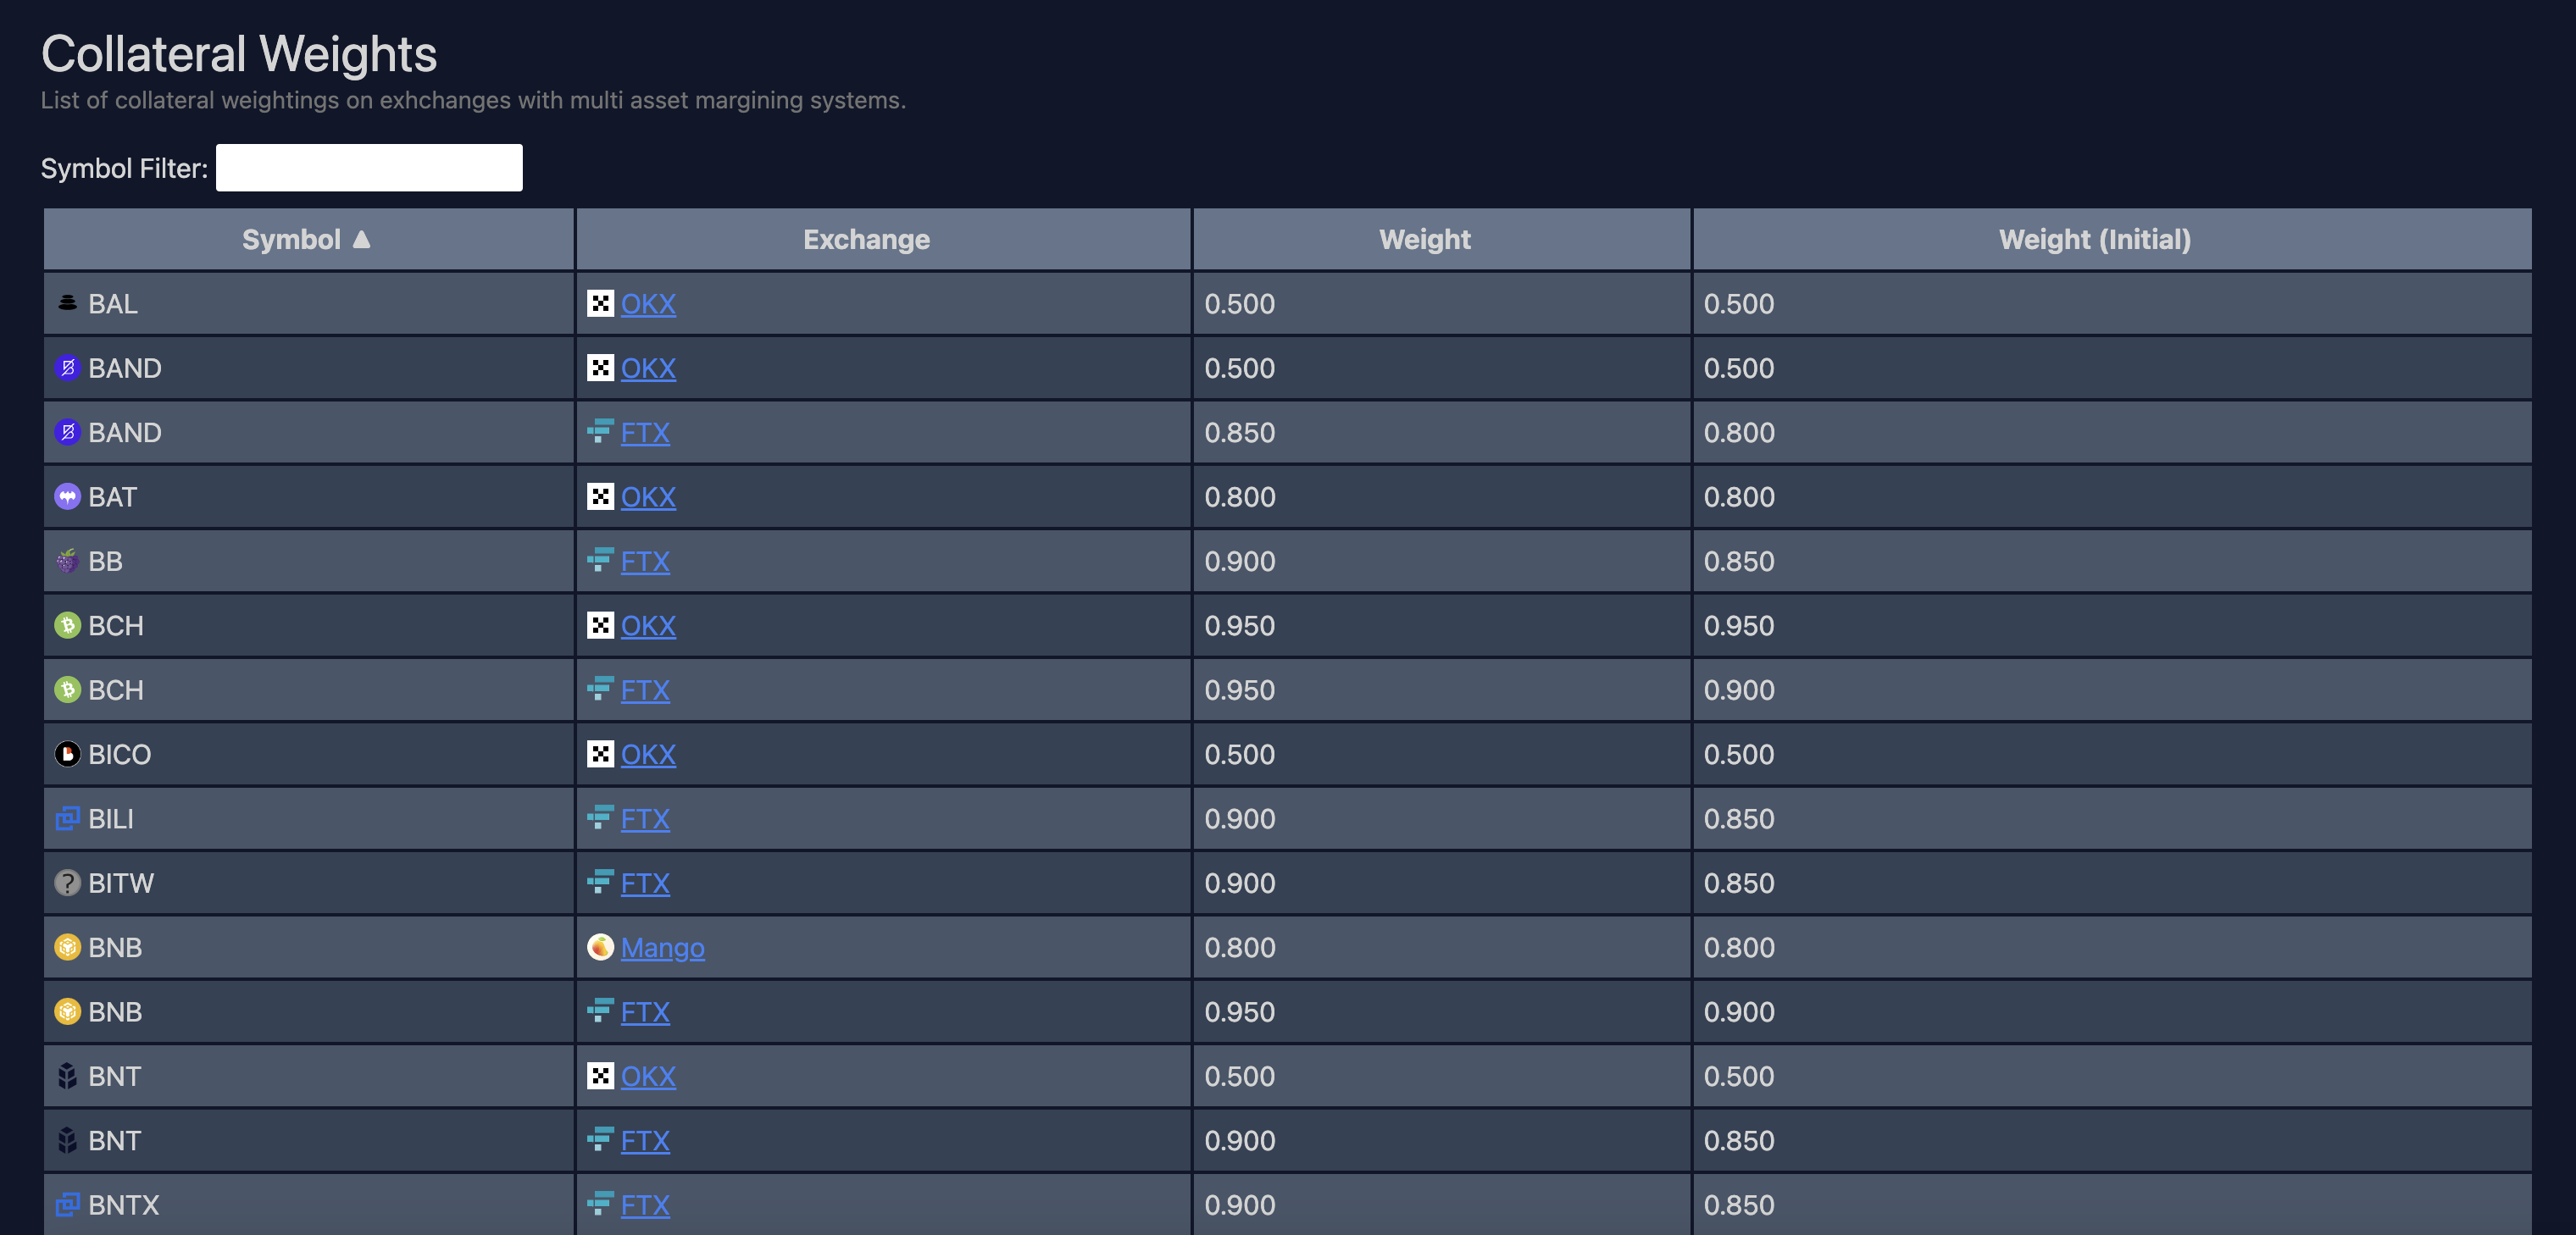
The collateral weights for assets on exchanges that support cross-asset margining.
Limitations
While this tool is “real time” in a sense (it checks the data every few minutes), I would have loved to have made this fully real time with websocket streaming, etc. However, for calculating basis trades general trends tend to be more important, so I favoured a simpler approach rather than trying to stream the contents of every exchange.
Because the data has some delay, using absolute prices for calculations can be complicated since even a small gap between snaps of two instruments might result in radically different prices, even if e.g. the basis remains the same. As such, the calculations for the trades are done in a less accurate “priceless” fashion, by using percentages instead, and making other less real-time assumptions for calculating slippage, spread, etc. Perhaps in the future if there is interest in it, I might consider a more heavyweight version with proper real time updates.
I also think that there are likely much better ways of assessing variable basis trades. Currently, the 7 day average funding rate is used, but obviously that can be quite inaccurate if there is a big shock in the market. Possibly using something like an exponential moving average might make sense, but I leave it as future improvement.
Edit Apr 2023: Cleaned up links
Glossary
- Annualised Basis
- The basis represented as if it was applied to an entire year.
- Auto-deleveraging
- A type of socialised loss mechanism. See here for more information.
- Basis
- The difference between the price of a derivative and its underlying.
- Basis Risk
- The risk that the basis of a derivative will change not in your favour.
- Calendar Spread
- A type of basis trade using futures for both legs.
- Cash And Carry
- A nickname for a long spot short future basis trade.
- Cash Settled
- When futures are not Physically Settled, but the difference in cash is exchanged instead.
- Clawback
- A type of socialised loss mechanism. See here for more information.
- Delta (
- A measure of how the price of a derivative changes vs. its underlying.
- Delta Neutral
- A portfolio that has no exposure to the price of the underlying (no delta).
- Delta One
- A financial product which has a Delta of one.
- Fixed Return
- A return that does not change.
- Funding
- A mechanism used by perpetuals to tether their price to the price of their underlying.
- Funding Rate
- The rate at which funding is paid. A positive rate indicates that longs pay shorts, and vise versa for a negative rate.
- Future
- A derivative which gives the buyer the obligation to receive the underlying from the seller at a specific time in the future.
- Haircut
- A discount rate applied to an assets value when it is used as collateral.
- Hedging
- The act of mitigating risk using certain financial instruments.
- Initial Margin
- The initial “deposit” required when opening a new derivatives position.
- Inverse Contract
- A type of derivative whose margin currency is the same as its base currency.
- Leg
- An individual position as part of a larger trade.
- Leverage
- A multiplier that represents the size of a margin loan provided for a position. E.g. 5x means an 80% loan was provided for the position.
- Liquidation
- To close out a position whose equity has fallen below the maintenance margin requirement.
- Locking In The Basis
- To put on a basis trade using a future.
- Maintenance Margin
- A margin level which must be maintained for a position not to be liquidated.
- Perpetual
- A derivative whose price is tethered to its underlying via the funding mechanism.
- Portfolio
- A combination of financial instruments.
- Socialised Loss Mechanism
- A mechanism used as a last resort by exchanges to avoid negative equity.
- Underlying
- An instrument that a derivative derives its price from.
- Variable Rate
- A rate that changes over time.